Observe and troubleshoot
Traffic Lens
Paint utilization and bandwidth on the topology, explore flows in the Traffic dock, and jump to capture.
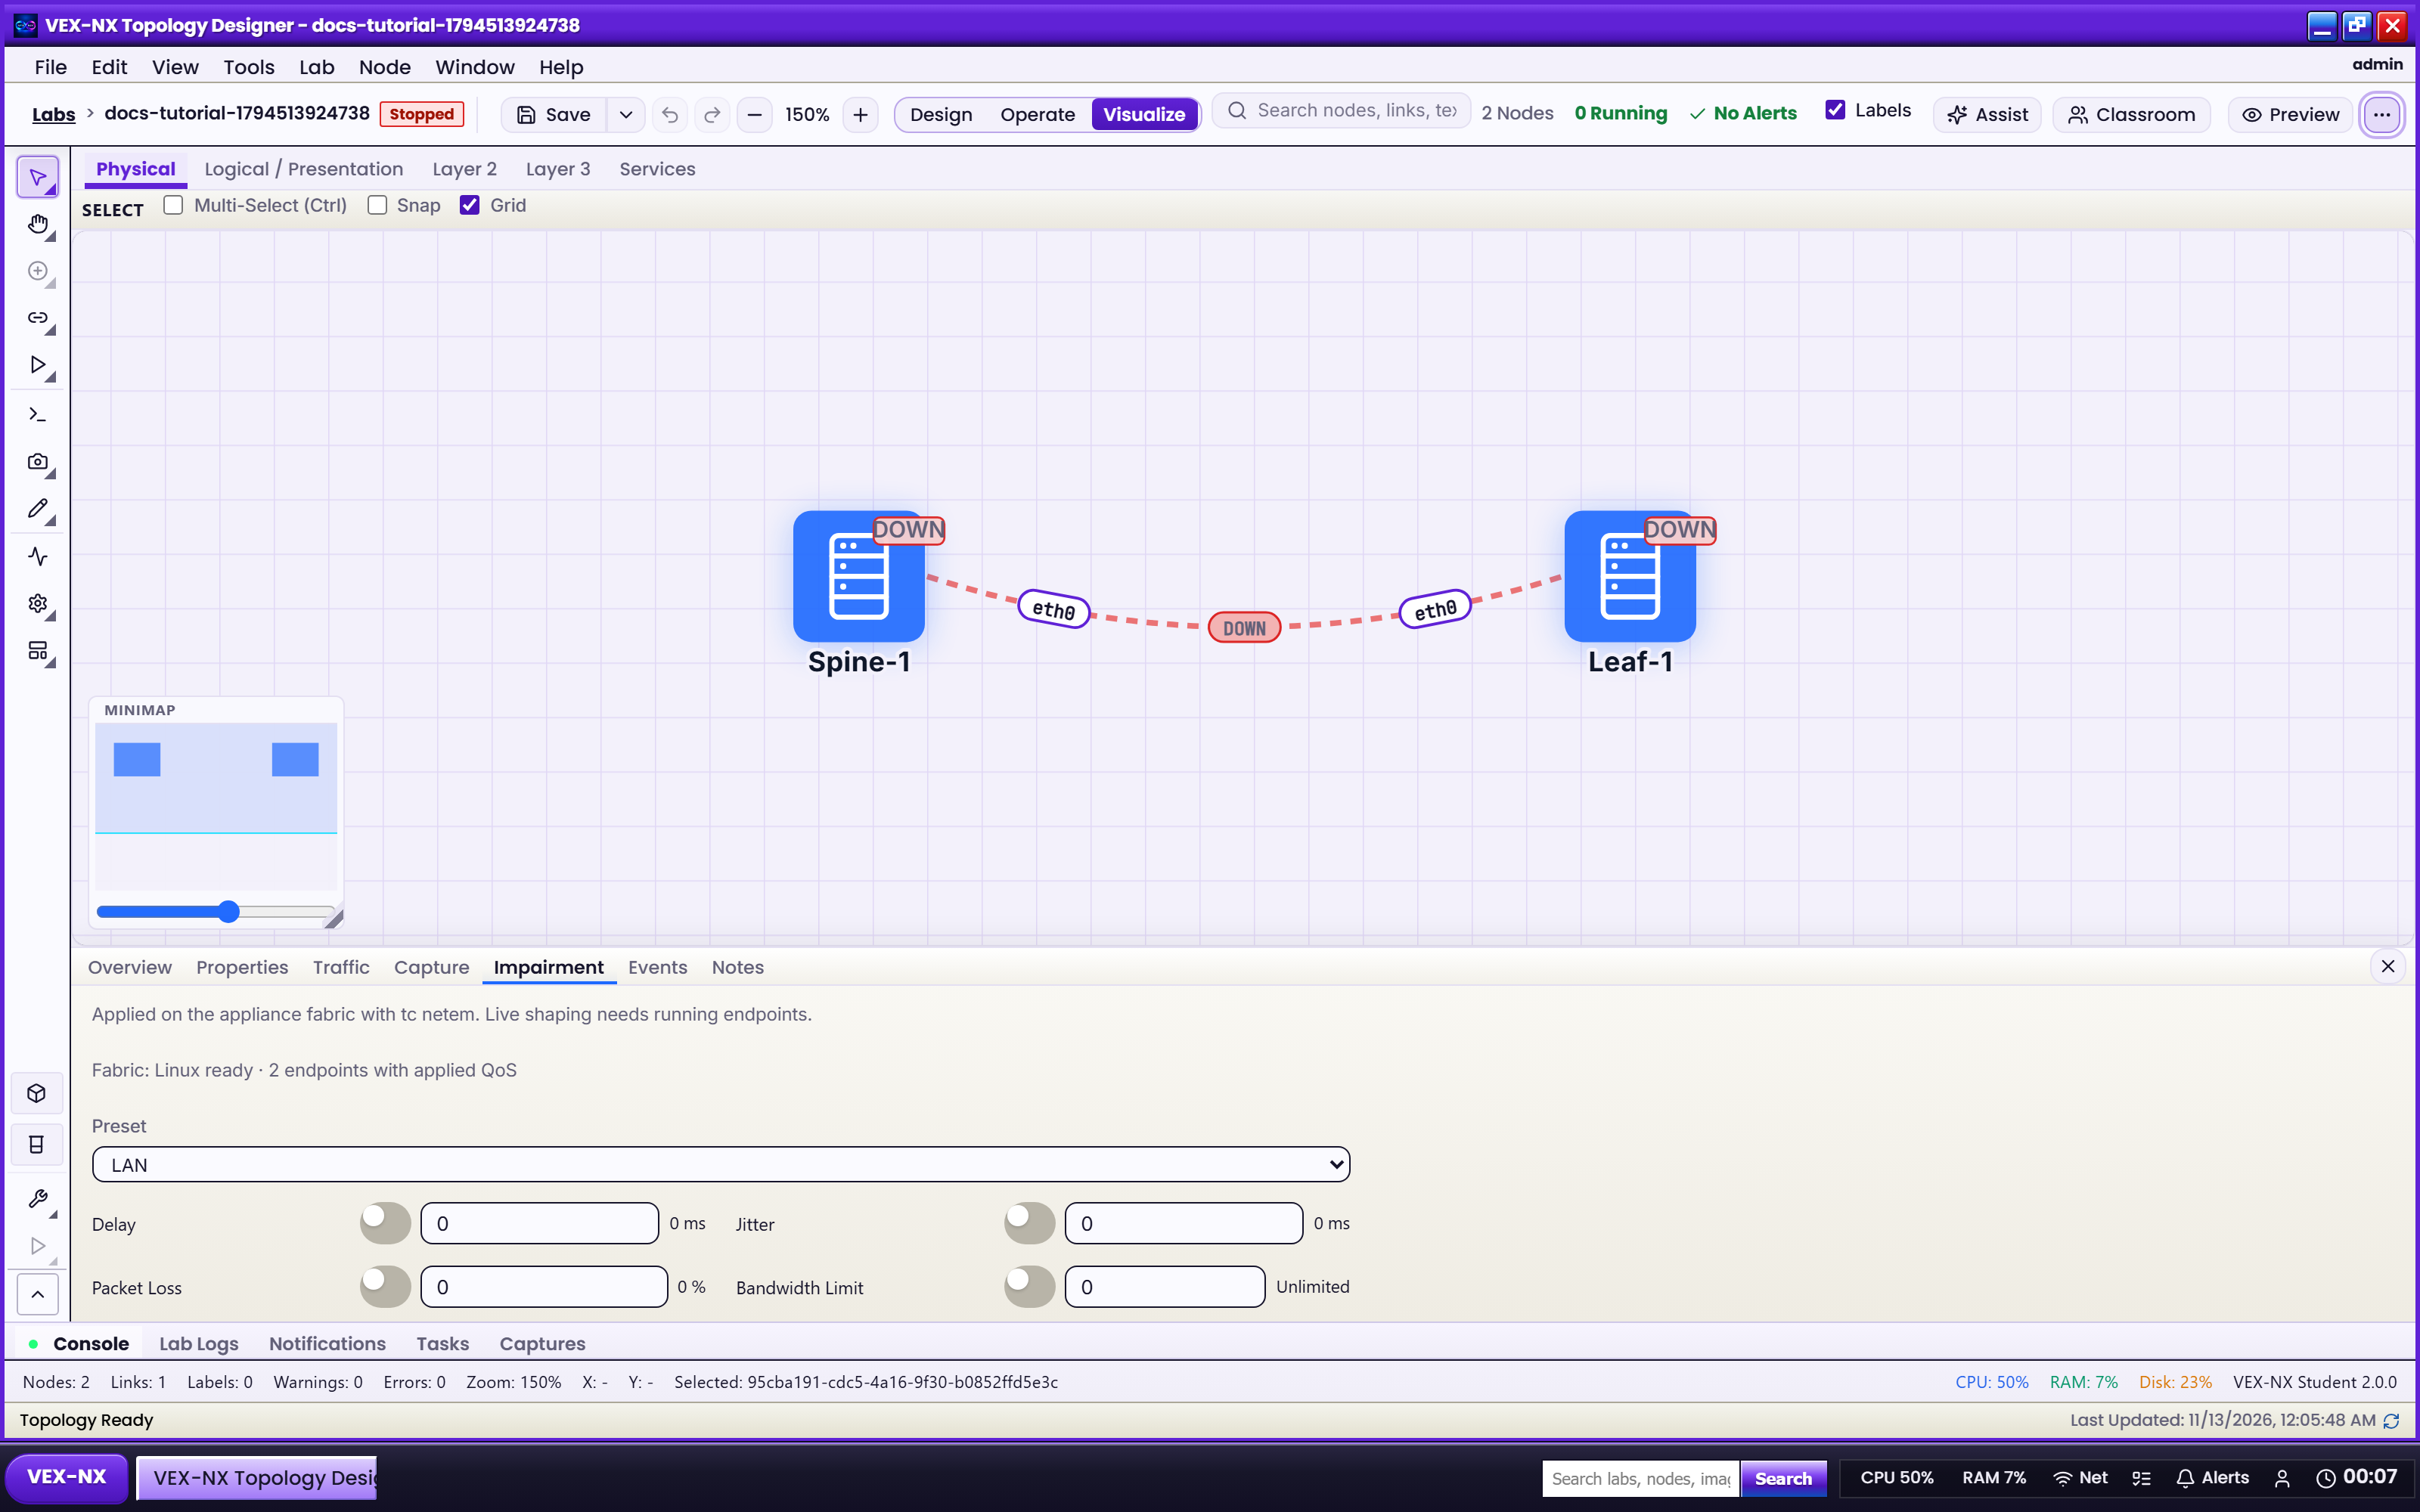
Operate tells you nodes are up. Traffic Lens shows how busy the links are, so you can demonstrate congestion and failover and hand off to packet capture without leaving the canvas.
Open Traffic Lens
- Open a lab with running nodes, or start them in Operate.
- Click Visualize on the workspace bar.
- Open Traffic from the tool rail, or More → Traffic. Links are coloured by utilization.
- Hover or select a busy link to see its numbers. If everything is zero, generate some traffic, for example with
ping.
Switch metrics
Open the Traffic mode picker and choose Bandwidth, or another mode such as packets per second or heatmap when listed. The canvas paint follows the metric you pick.

The Traffic dock
Use the dock tabs, Interfaces, Flows, Timeline, Packets, Protocols, Events, and Alerts (as offered), without leaving Visualize. Select a link on the canvas to focus the dock on it.

Note
When nodes are running and fabric statistics are available, rates are live. When the backend is quiet, the UI may show sample or zero rates; that is the visualization framework, not a promise about real traffic. For evidence, use packet capture.
Leave Traffic Lens
Switch the Visualize lens back to Overview, or change mode to Design or Operate.
If it fails
| Symptom | Fix |
|---|---|
| No paint | Start the nodes, ping across the path, wait a few seconds. |
| Mode does nothing | Refresh the lab and confirm Visualize + Traffic is active. |
| Classic link inspector hidden | Use the Traffic dock first, or exit Traffic. |
Related: Link inspector and impairment